
This morning I had the pleasure of seeing the view below in the office. A development team has visualized the use and adoption of a new feature they have recently deployed:
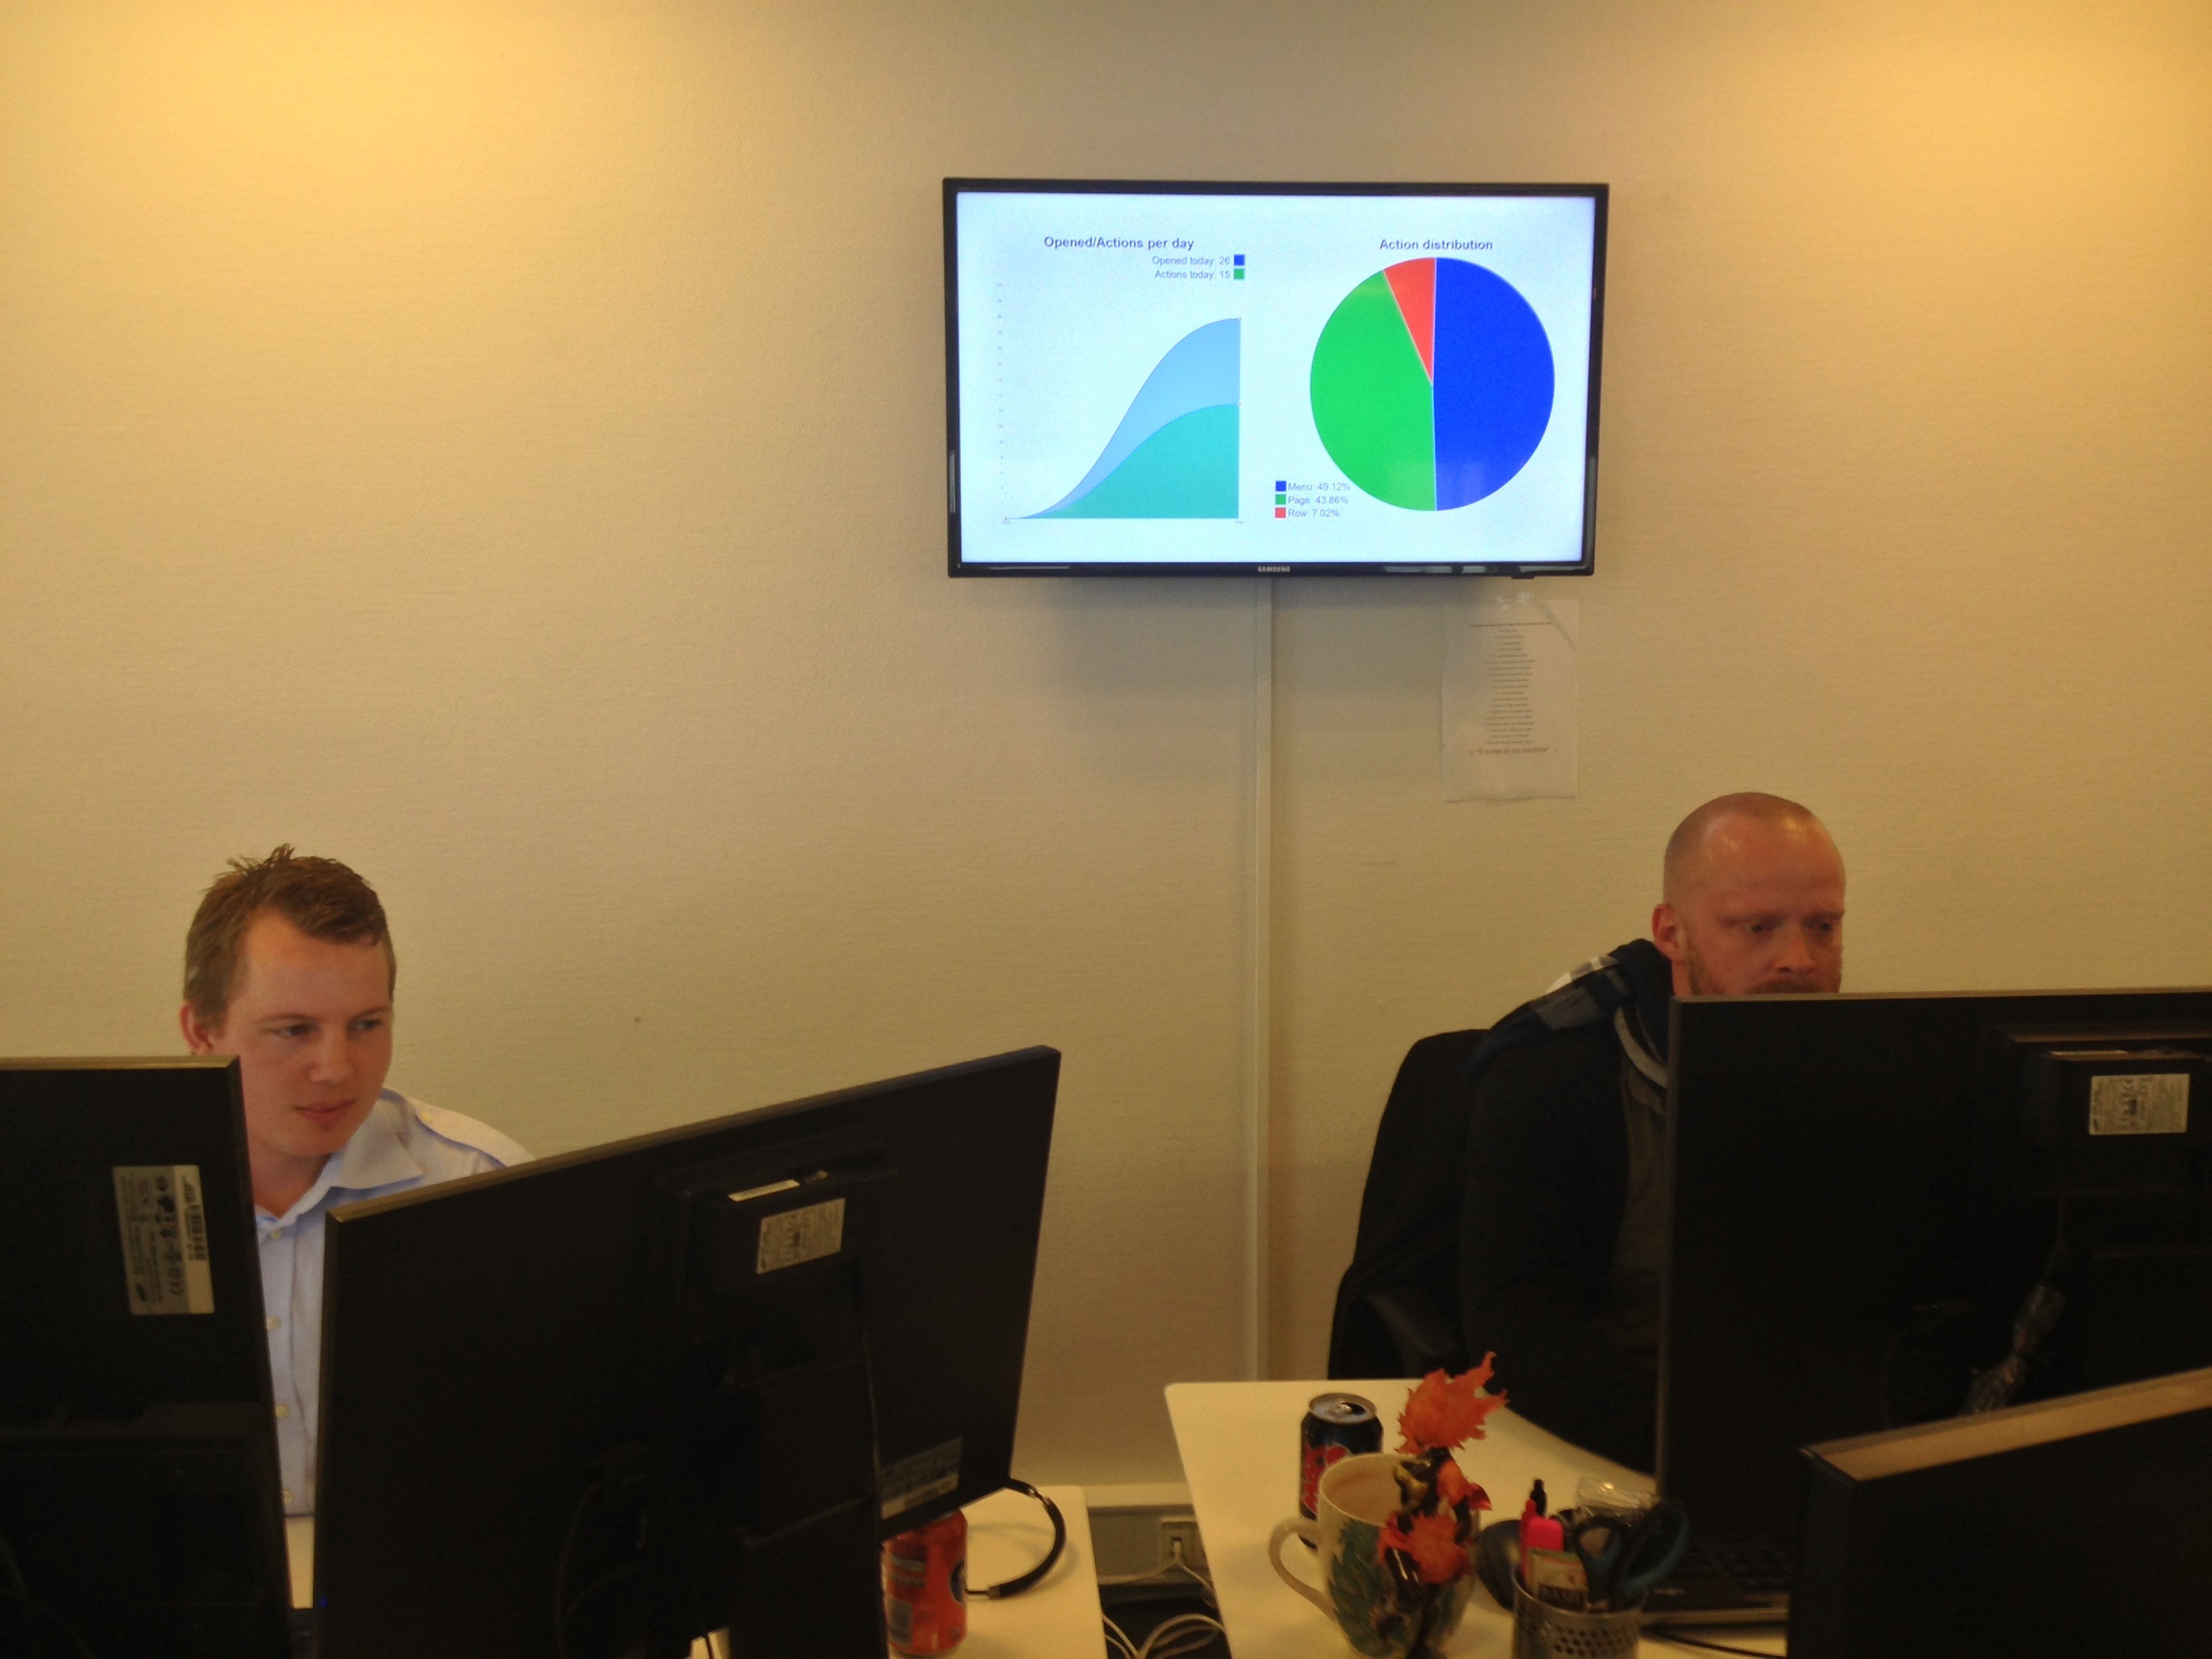
In line with our DevOps aspirations, they are monitoring how a feature is adopted by users – specifically, they are measuring the growth in the number of users utilizing the new feature (the wave curve on the left) as well as which parts of the feature users are most active on (the pie chart on the right).
This is of course just a small example of how we measure and evaluate customer response to the features we release, but a simple screen like the one above is actually a very useful way of bringing value to the team.
They can see immediate results of the work they do in the form of actual customers using and benefitting from their feature. Additionally, initiatives like this help to ensure that we always have an eye on the relevance and end-goal of the features we create, and ultimately bring us closer to our customers.
Have a great weekend – developers and customers alike!